WinDbg 101–Essential Debugging Techniques for Exploit Dev
Hello and welcome to the 2nd blog of the first series. In the previous blog, we dived into x86 architecture, from program memory and stack fundamentals to x86 CPU and its registers. In this blog, we will explore some functionalities of WinDbg, which we are going to use in this whole series. So better pay attention.
What is a Debugger?
We hear the words “debugging”, “debugging tools” too often, but what does this mean?
Basically, a debugger acts as a proxy between an application and the CPU, allowing interaction with memory and execution flow. Using a debugger allows us to view and interact with the memory and execution flow of applications. source
Most OS memory is divided into kernel-mode (ring 0) and user-mode (ring 3). This series focuses on user-mode debugging only.
While there are many debuggers such as Immunity Debugger and OllyDbg, we will stick to WinDbg as it is a powerful tool made for user-mode and kernel-mode debugging, unlike other tools.
To make life easier, we will use debugging symbols.
Debugging symbols are extra information added to a program to help developers understand what’s happening when it runs. They include things like function names and variable names, making it easier to find and fix bugs. I mean, it’s easier and good for the eye to see a function name instead of raw assembly, right?
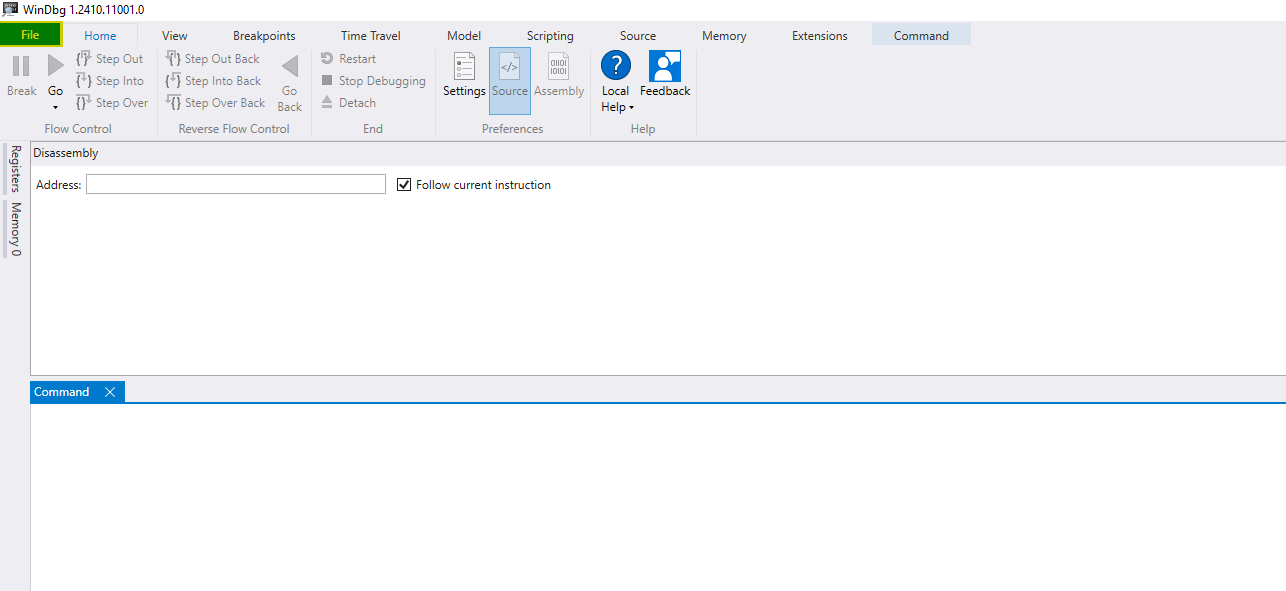
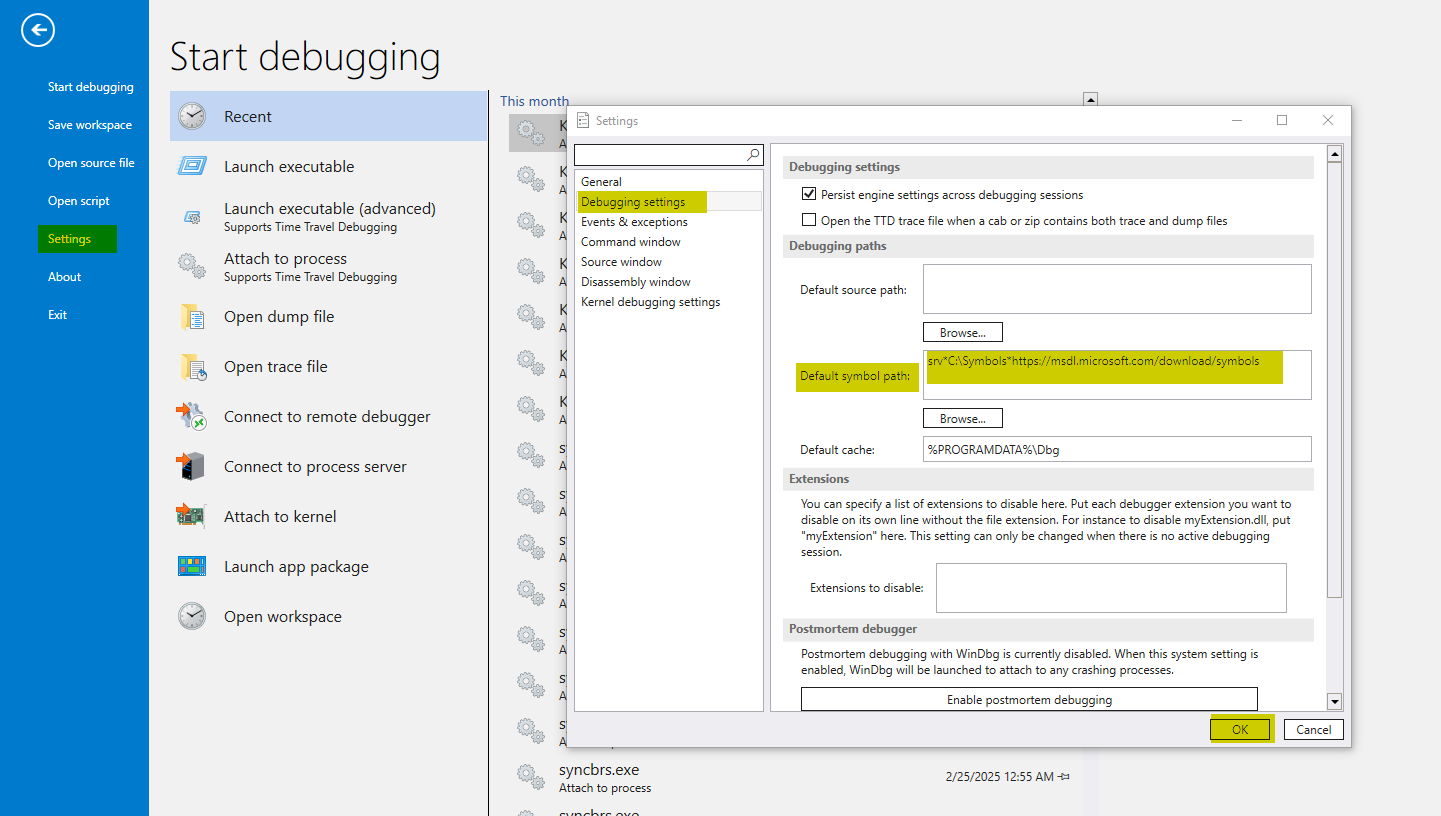
So how can we load these symbols? When opening WinDbg, you will need to go to File > Settings > Debugging settings and then put SRV*C:\Symbols*https://msdl.microsoft.com/download/symbols in the Default symbol path.
Great! We did set our symbol path. We can issue to download the symbol files (.pdb extensions) with the command .reload /f before conducting any debugging!
Now, I will go through multiple commands and showcase with examples the results of each one. I will cover only the commands we will need in the whole series, and they are more than enough.
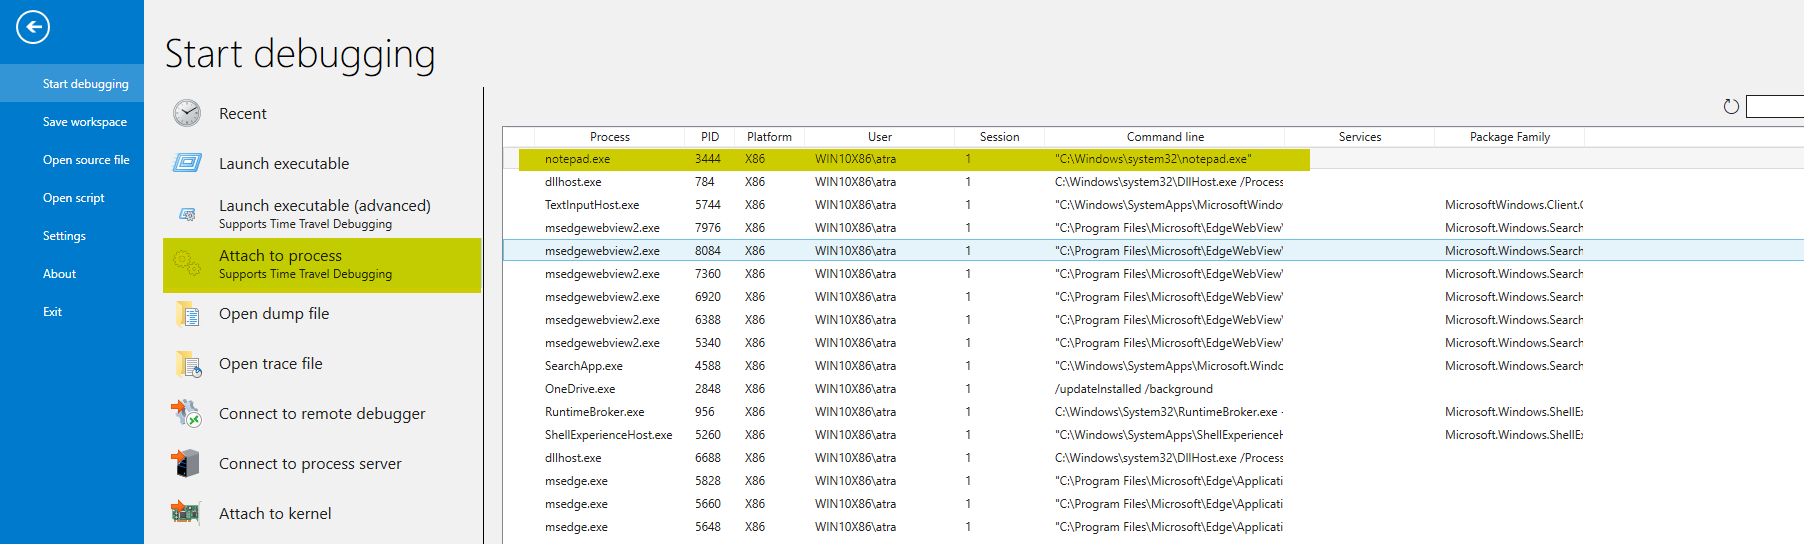
First, we’ll launch a Notepad instance and connect our debugger to it. Notepad will be our testing program to debug.
To do that, go to File > Attach to Process > notepad.exe
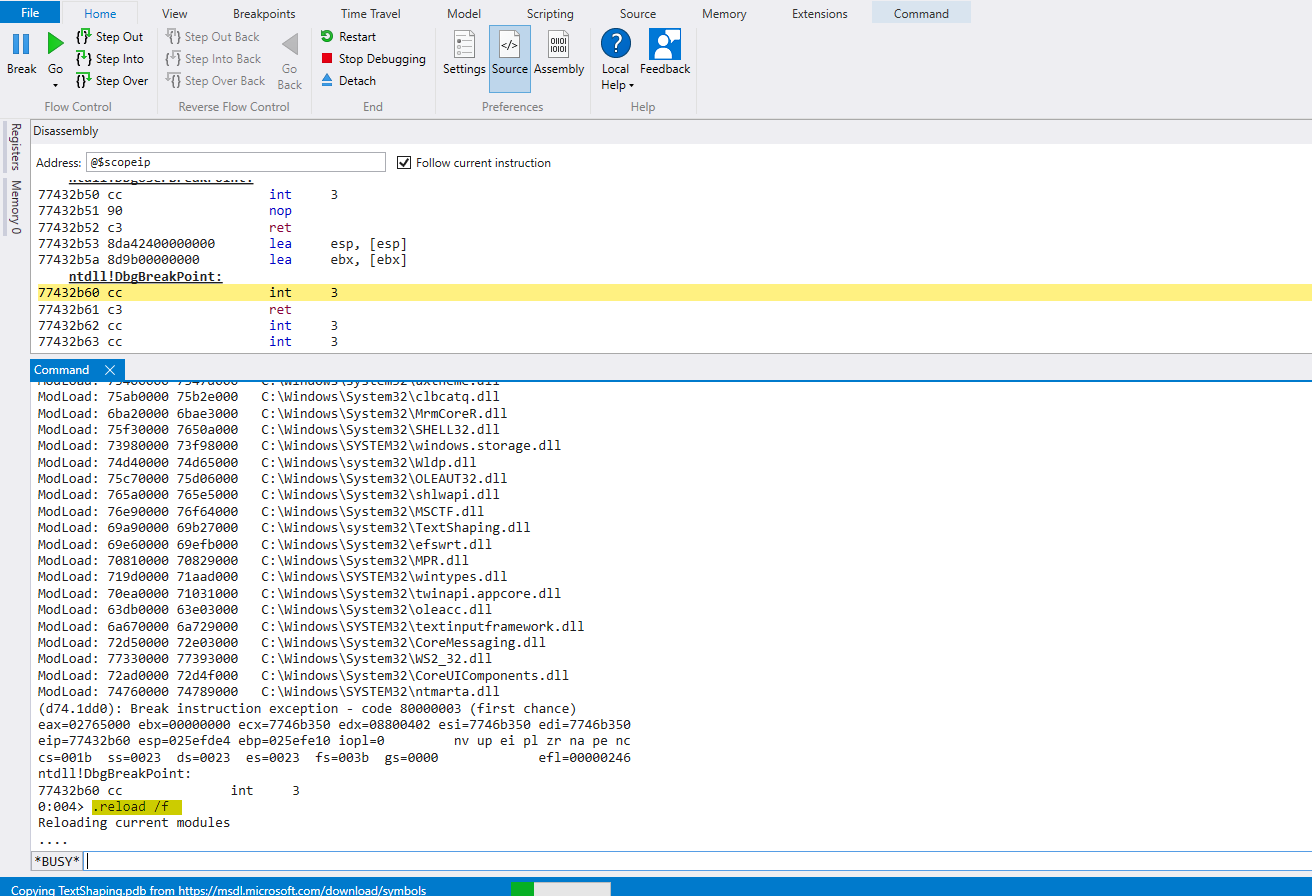
Now, we execute .reload /f and then wait until the download is completed.
Sweet! Time to learn some debugging commands.
- Unassemble (u): The result of the
ucommand should be the assembly instructions of a program/functions.u kernel32!GetCurrentThread - Display Memory Content: We can read process memory content using the display command followed by the size indicator.
db: Display the content of an address in 1 byte.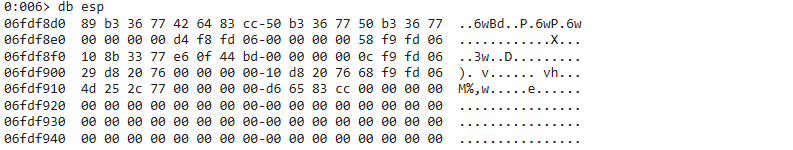
dw: Display the content of an address in WORDS (2 bytes).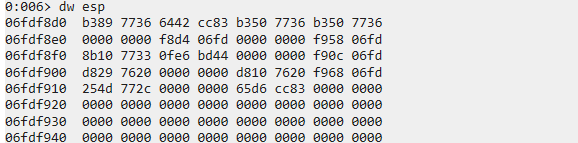
dd: Display the content of an address in DWORDS (4 bytes).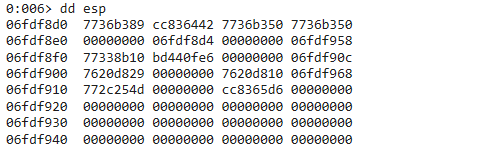
dq: Display the content of an address in QWORDS (8 bytes).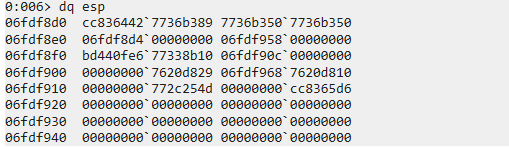
dW: Display the content of an address in ASCII characters along with WORDs.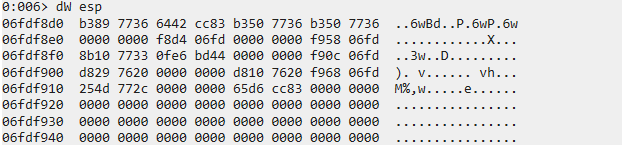
dc: Display the content of an address in ASCII characters along with DWORDS.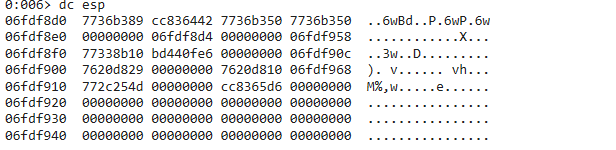
- Display Structures: WinDbg allows us to display structures. This is really useful when conducting our analysis.
- Use the
dtcommand to display the contents of a structure. Here, we will see what the TEB structure contains.dt ntdll!_TEB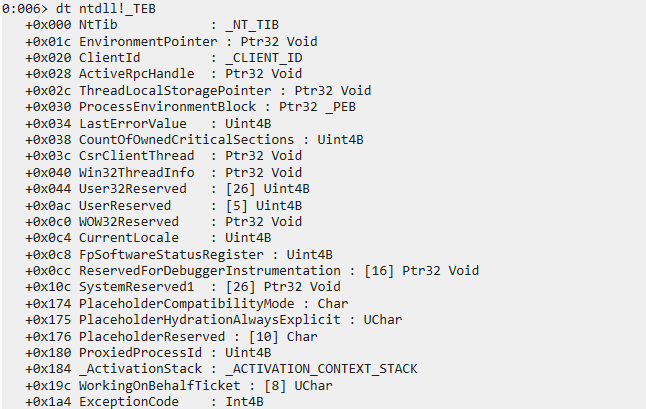
- We can also see that inside the TEB structure resides another structure at offset 0x00, “_NT_TIB”. To dump all nested structures in a structure, we can use the
-rflag to recursively dump them.dt -r ntdll!_TEB @$teb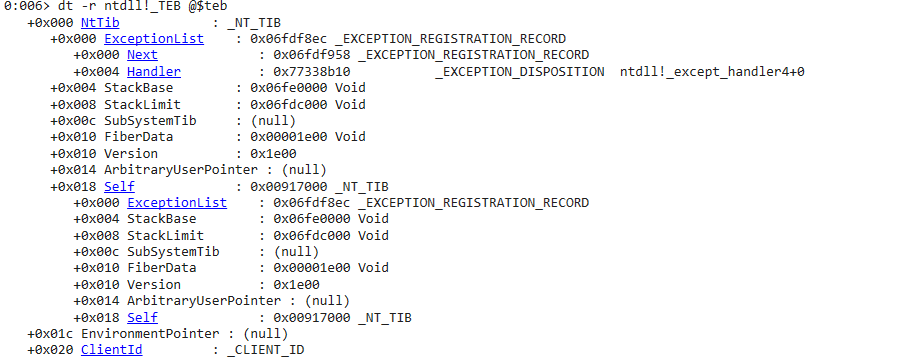
- We can also display the size of a structure. This may be useful since some Windows APIs take structures as arguments, so it’s necessary to know their size too.
?? sizeof(ntdll!_TEB)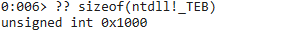
- Use the
Thank you for taking your time reading this long blog. It was needed and serves as a mandatory prerequisite since we will mainly be using WinDbg. Congrats on learning how to use it! Now that we’ve covered most of its commands, we are ready to dive into the meat of the series: memory corruption vulnerabilities and how to exploit them. In the next blog, we will cover what a buffer overflow is and how to exploit it.